Google Docs Integration
The Tank Controller devices can report current pH and Temperature readings for the tank to a Google Sheet.
This will allow viewing of the current tank status from anywhere you have an internet connection.
Google Docs integration, however, is optional and the basic functionality of the device is not affected if you do not complete these steps.
Creation of the Google Sheet and Script
To perform the following steps you will need a Google account, and be signed into that account. Go to the following link to find the Tank Controller Monitor template: Monitor Template
Make a copy of this template for yourself by clicking on “File” in the menu, then “Make a copy”. This will bring up the “Copy document” dialog box. In the box labeled “Name”, the default name will be “Copy of Tank Controller Monitor Template”. Instead, give the document any name that you wish. Then click “OK”.
Next find the spreadsheet ID of your copy of the Tank Controller Monitor spreadsheet and copy it. You can find it in the URL address of the sheet. I have an example below in which the spreadsheet ID is marked in red.
https://docs.google.com/spreadsheets/d/17csF55yQlx2HJP9xseCQdg8_DI6Znge3YeeOjI1ZSZs/edit#gid=0
Navigate to the url: script.google.com.
Click the “New project” button in the upper left of the page to start a new script.
This will bring you to a code window.
Into the code window paste this code: Google Script Template.
Then replace the section that says “<enter spreadsheet ID here>” with your spreadsheet ID.
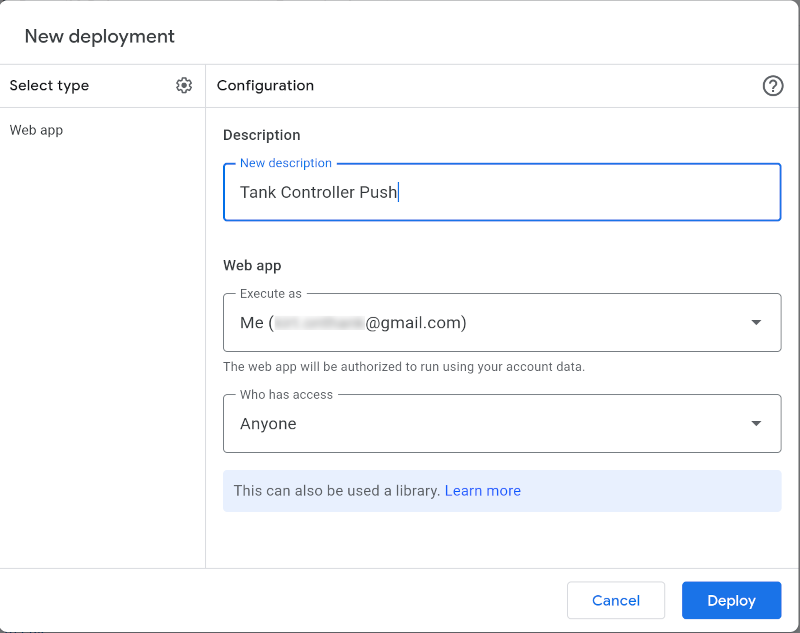
Next, in upper right click the “Deploy” button, then “new deployment”. In the window that pops up, click the cog next to “Select type”, then select “Web app”. Then under “Configuration”, type in anything that makes sense under “Description”. Under “Execute as” select “Me”. Then under “Who has access”, select “Anyone” (not “Anyone with Google account”). Then click “Deploy”.
When you click “Deploy”, another window will appear that says “The Web App requires you to authorize access to your data.”.
Click “Authorize access” and select your Google account in the next window.
Next a window will say “Google hasn’t verified this app”.
Click “Advanced” in the lower left and corner and “Go to Untitled project (unsafe)”.
In the next window click “Allow”.
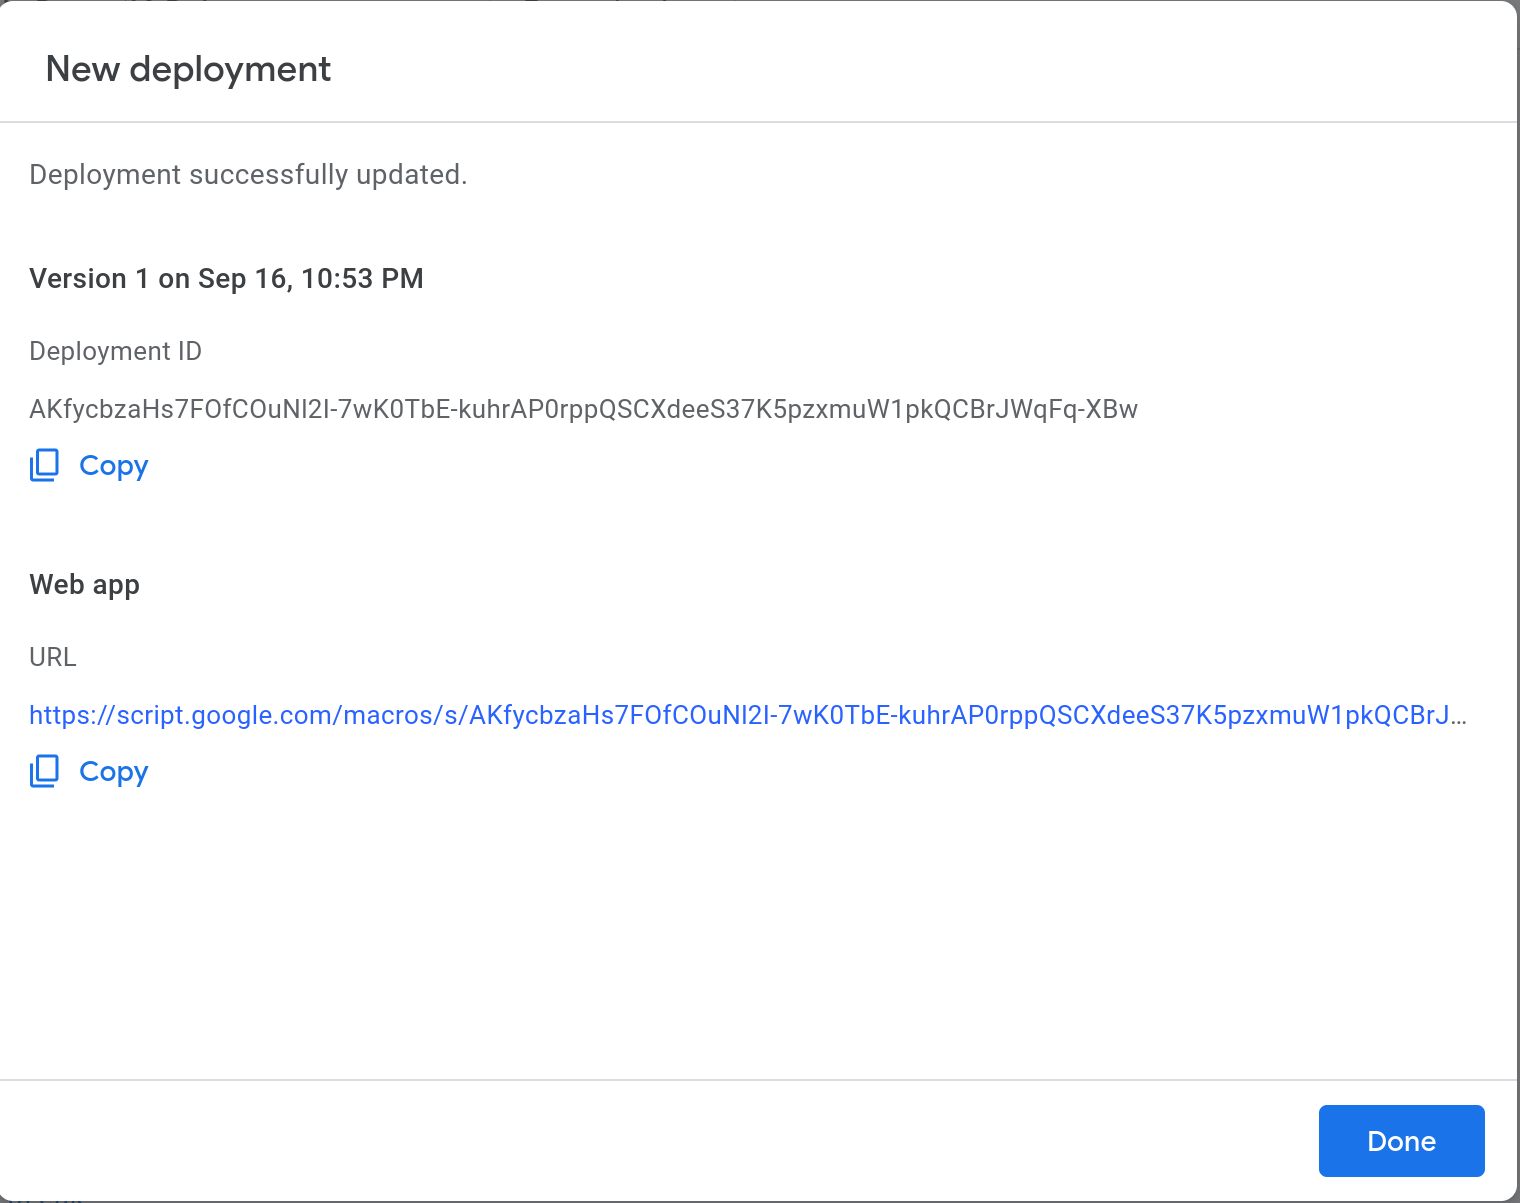
Another window will show up that will say “Deployment successfully updated.”.
Under that it will say “Web app”, and under that “URL.”
Copy that URL by clicking the “Copy” button below it and save it somewhere you can find it again such as in a text document or a Word document.
You will need this URL when setting up PushingBox in the next section of the instructions.
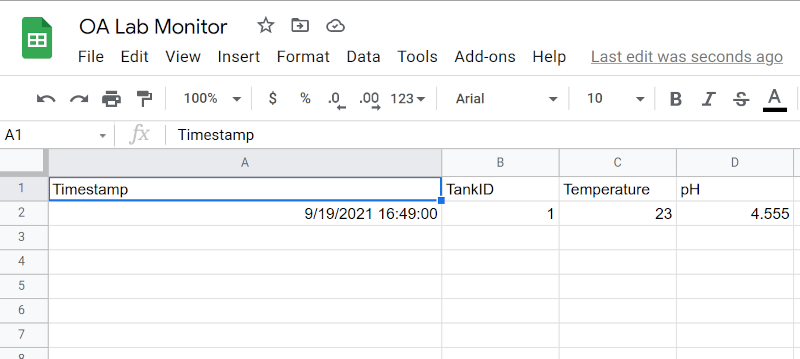
Now, lets test if the script is working. Paste the URL you just saved with “?tankid=1&tempData=23&pHdata=4.555” added to the end of it into a new browser tab.
Does “ok” show up in the browser?
If so, check your Tank Controller Monitor spreadsheet.
You should see the data show up under “Raw_Data” tab that report Tank 1 with a temperature of 23 and a pH of 4.555. The data should also appear for Tank 1 under the Dashboard tab.
Setting up PushingBox
Navigate to https://www.pushingbox.com/ and click “Login with Google” in the upper right hand corner. Complete the login with your Google login credentials
Next, click on “My Services” in the menu towards the top of the page, then click the “Add a Service” button on the next page.
Now click on “Select this service” next to “Custom URL”. It will be at or near the bottom of the options.
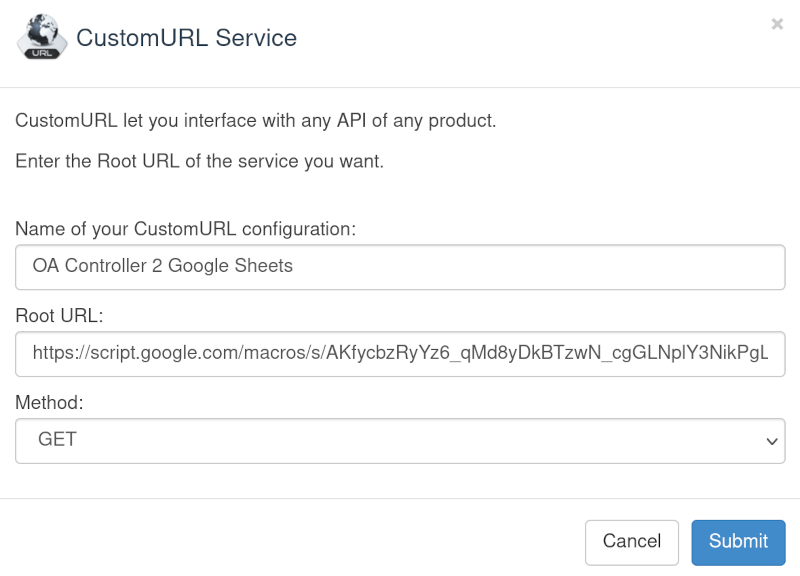
Give this service a name in the top box labeled “Name of your CustomURL configuration:”. It doesn’t really matter what the name is, as long as you can recognize it.
Now, paste google script macro “Current web app URL” into “Root URL” (without the “?tankid=1&tempData=23&pHdata=4.555” you added for testing).
Leave method as GET and click the “Submit” button.
Now click on “My Scenarios”, then in the box under “Create a scenario or add a device” put in some name of your choosing (I use “Tank ID, Temp and pH Push”), and click “Add”.
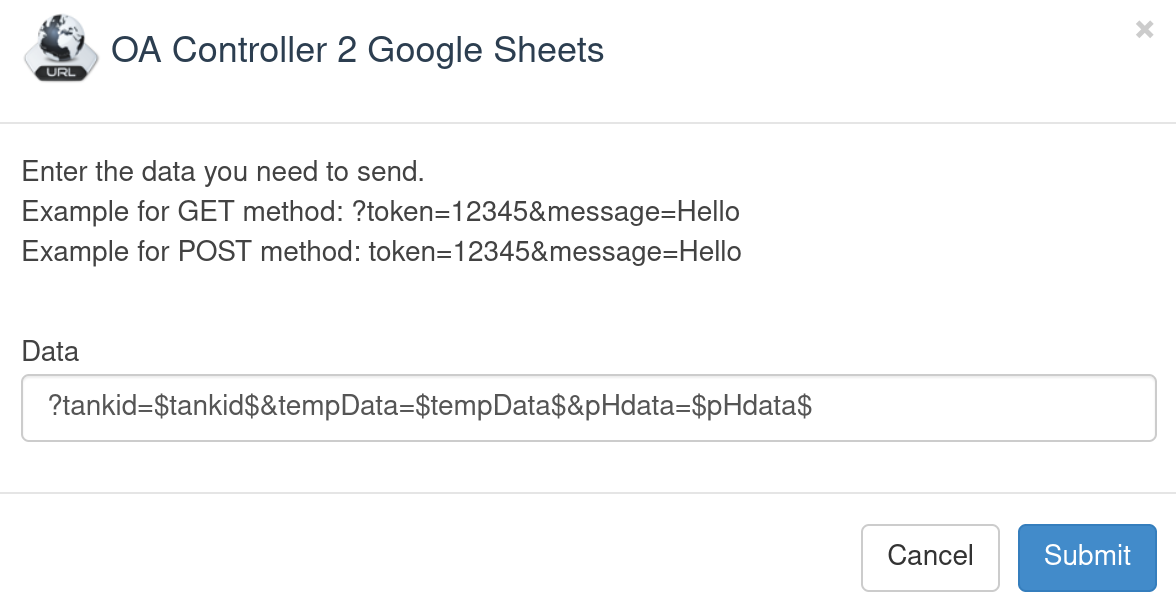
Now, click the “Add an Action” button. Then, click “Add and action to this service” next to the service you made in the previous step.
In the box under “Data” copy and paste in the text: “?tankid=$tankid$&tempData=$tempData$&pHdata=$pHdata$” (without the quotes). The click “Submit”.
Now, copy DeviceID that should be right under the scenario name. It should start with “v”.
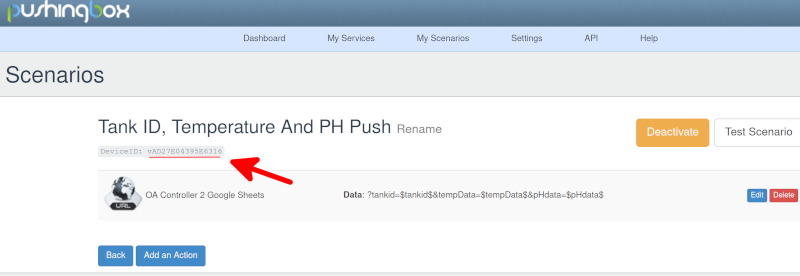
Now, copy that DeviceID into Tank Controller Arduino code on line 7 where it says PushingBoxIdentifier. You must have the quotes around the DeviceID.
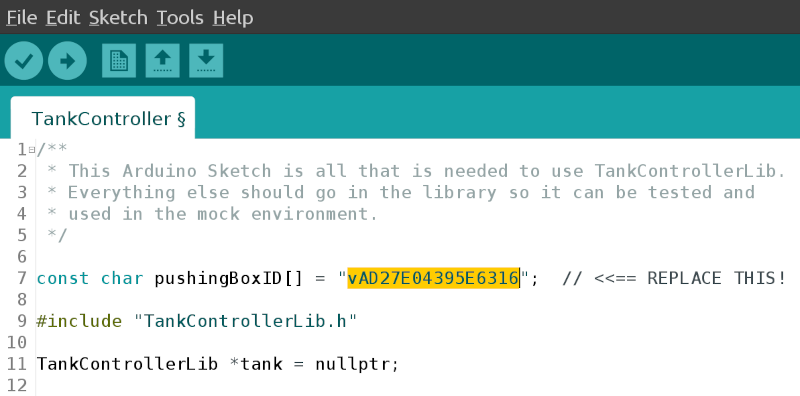
Once you flash this code onto your Tank Controller Arduino, it should start to upload temperature and pH data to the Google sheet at the interval at which your Google Sheet interval is set for in the device.
Using the Tank Controller monitor sheet
Each Tank Controller will, if setup to write to Google Sheets, periodically write tank ID, current temperature and pH into the sheet labeled “Raw_Data” in the Tank Control Monitor (tabs at the bottom of the page).
From there, all entries in the Raw_Data sheet for a given tank ID will be pulled into that Tank’s individual sheet.
A summary of all of the tanks reporting to the Tank Control monitor will appear in the “Dashboard” sheet.
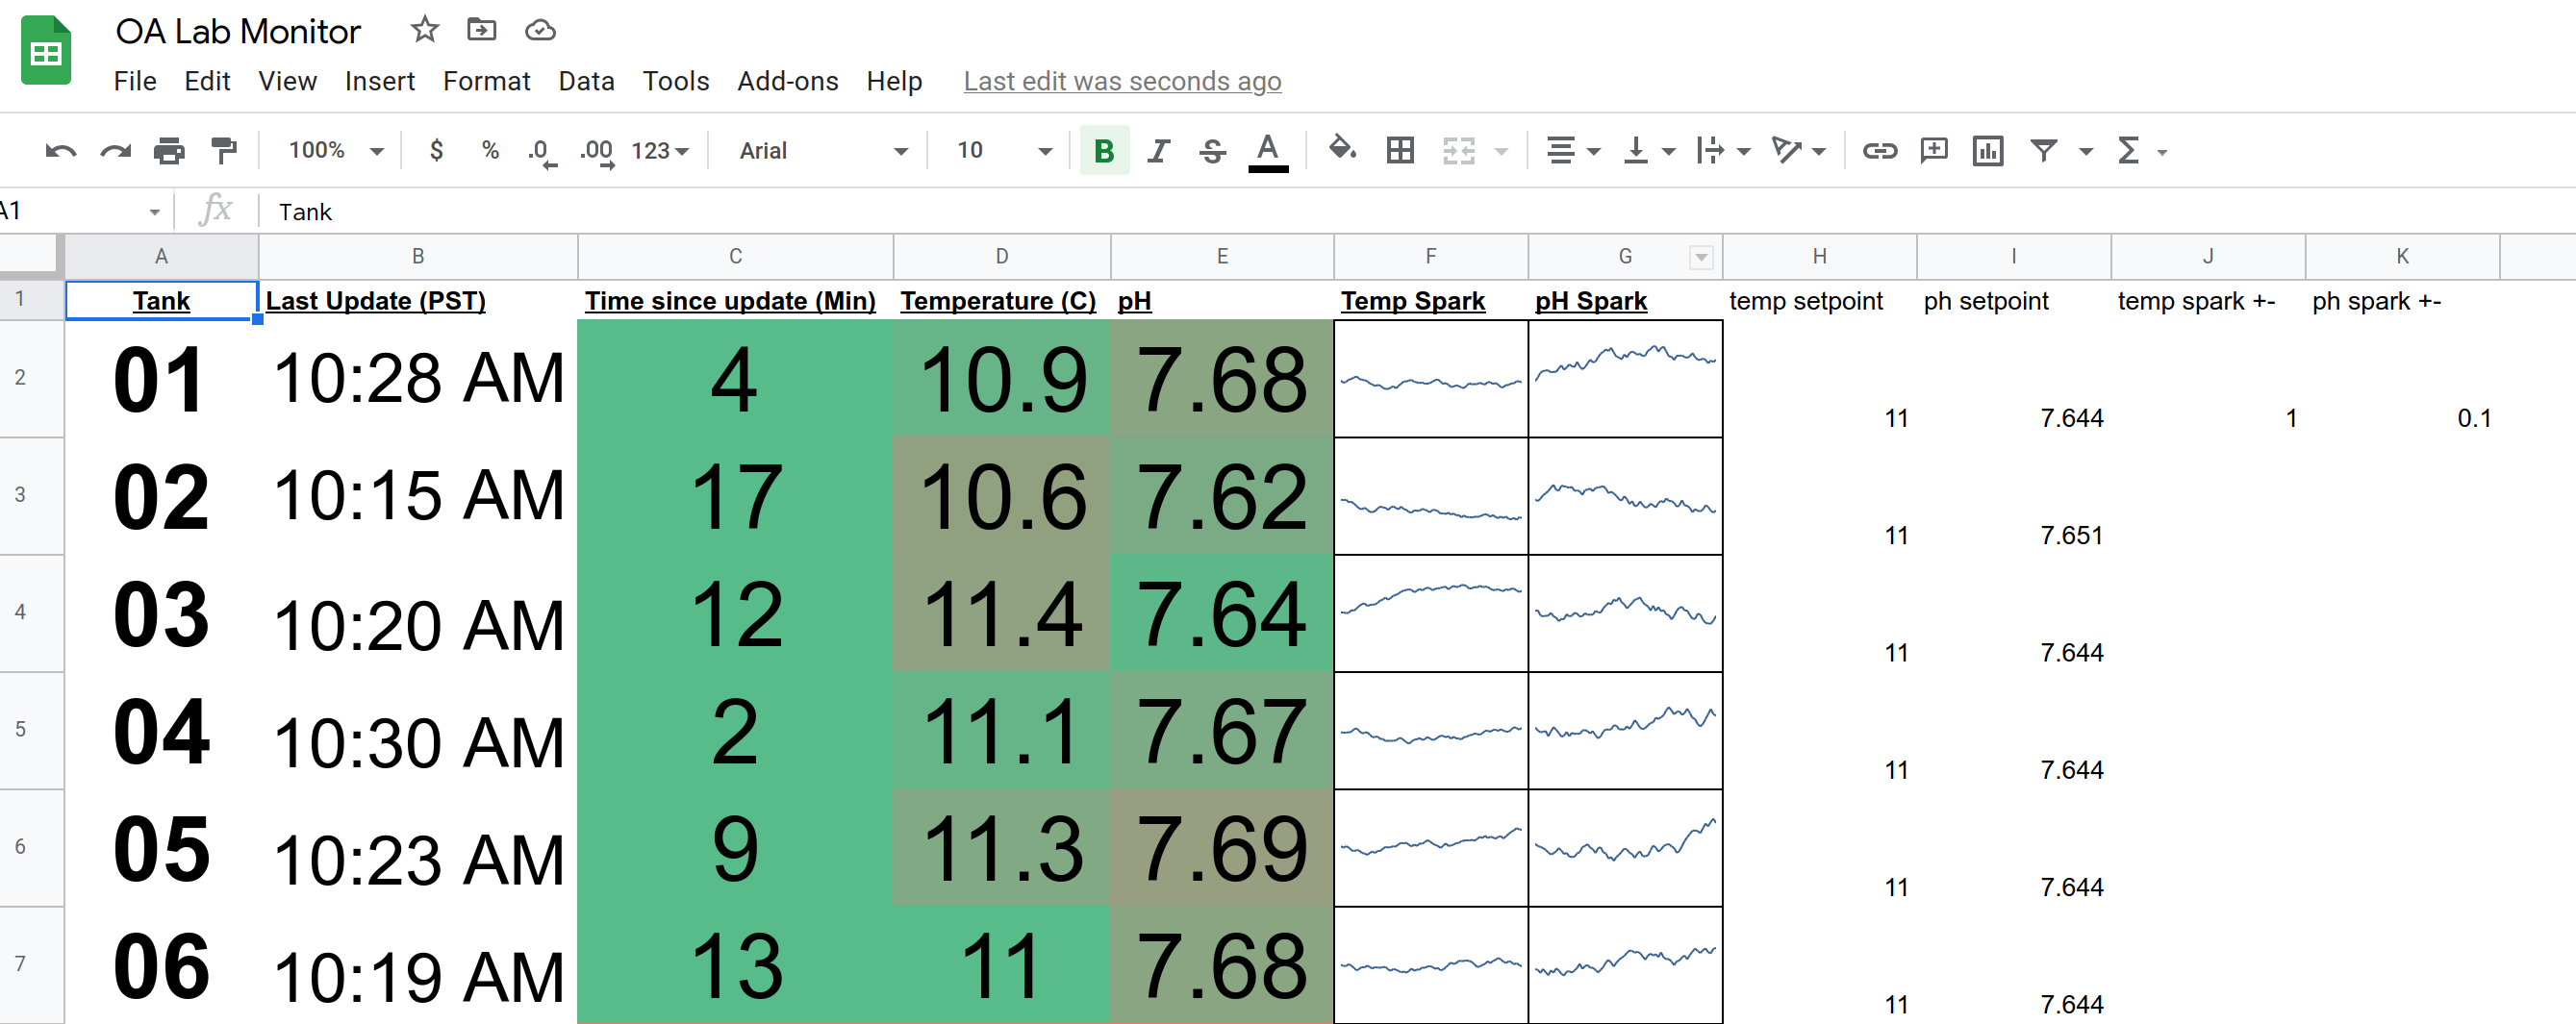 (This is simulated, not real tank monitoring data)
In the “Dashboard” sheet, each row holds data from a specific Tank ID (and therefore an individual Tank Controller if each have been assigned a different Tank ID). The first column give the Tank ID #. The second column, titled Last Update gives the time when the last update was sent from the Tank Controller. The third column gives the time that has elapsed since the last data was sent. The fourth and fifth columns give the most recent temperature and pH readings, respectively, sent by the Tank Controller.
Spark-line graphs
The sixth and seventh columns contain spark-line graphs of the recent trends in temperature and pH.
The midpoint of these graphs is set by the “temp setpoint” and “pH setpoint” columns (columns H and I) in the given row.
The y-axis range is set for all graphs by the “temp spark +-“ and the “ph spark +-“ (columns J and K).
By default the spark-line graphs show the last 70 data points. If the device updates occur every 20 minutes, this means the last 24 hours are displayed in the spark-line.
You can change update interval on the Tank Controller itself.
You can change the number of past data points displayed on the spark-line in the sheets or the individual tank controllers.
Navigate to one of those sheets, and select cell “H2”. Here you should see a function that looks like this:
=SORT(QUERY(A2:D,"order by A desc limit 70"),1,1)
Simply replace 70 with the number of data points you would like displayed and return to the “Dashboard” sheet.
Color Formatting
I have found it helpful to have conditional formatting for the columns displaying Time since update, temperature and pH.
I have them set to be green when values are close to the expected value, and turn more red when the values deviate from the expected.
It allows me to quickly scan the data and see what tanks are “misbehaving”.
The template Tank Controller Monitor has this conditional formatting activated, but you will likely want to change the values to reflect your specific experiments.
To do this, select a cell you would like to change the formatting for.
Next, Select “Format” in the menu, then “Conditional formatting” from near the end of the list.
A panel will appear at the right hand side of the screen, and there should be “Color scale” shown as one of the choices. Double click it.
Next, a panel should appear that is titled “Conditional format rules”.
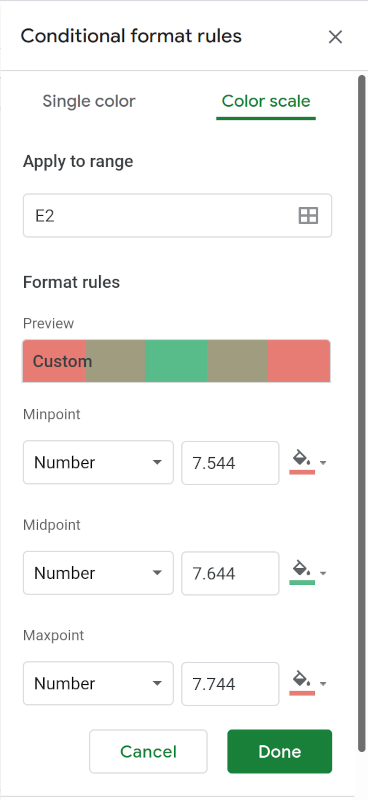
You should see on the panel a section for the “Minpoint”, one for the “Midpoint” and one for the “Maxpoint”.
In each section, there should be a drop-down menu in which “Number” is selected, followed by a value, follow by a color.
The midpoint is set to the pH setpoint. At this value, the color of the cell will be completely green.
The minpoint and the maxpoint (I usually set these to +- 0.1 above or below the setpoint for pH and +- 1 for temperature) are the values for which the color will be completely red.
Everything in between these values (midpoint and the minpoint/maxpoint) the color of the cell will be a gradient between green and red.
Therefore, even with deviations of the current by a small fraction of that difference the color will be shaded and the deviation will be visibly apparent.
You can set the midpoints/minpoints/maxpoints for each cell to any value that is useful to you.